We all realize by now that the real estate market is slowing due to a reduced buyer pool, caused in part by the increase in mortgage interest rates.
Here’s some advice to sellers who don’t want their home to sit unsold on the market.
1) Reconsider buying your replacement home first, expecting to sell your home immediately. That strategy was based on the difficulty in finding a replacement home. Now you can sell first, have a 45- to 60-day close and reasonably expect to find your replacement home before you have to surrender your current one.
2) Don’t price your home based entirely on recent comparable sales, but price it slightly lower. Buyers know the market is softening and will be looking for a good deal.
3) With an increased inventory of listings, it’s more important than ever to stage your home and improve its curb appeal as well as its interior appeal.
4) Listen to the market. If you get few showings and no offers in the first week, don’t wait to lower the price.
5) Magazine-quality pix and video are more important now to make your home stand out. Hire an agent who will order professional HDR still photos, shoot a narrated video tour and drone video, and market your home the way Golden Real Estate does.
When interviewing a listing agent, ask him or her to bring their Matrix productivity print-out instead of trusting their verbal description of their level of success with prior listings.
One of the most dependable indicators of a strong “seller’s market” is the number of listings which sell above their listing price, and by how much. Another is the number of days that a listing is on the MLS (“DOM”) before going under contract.
As shown in the chart below, drawn from REcolorado’s data for the period of January 2021 through last month, the seller’s market peaked in May and June of last year but has now surged again. All indications are that the surge will continue through the spring.
Average DOM is always higher than median DOM because there are many homes that languish on the market unsold because they are overpriced, or for another reason. What’s remarkable about this sellers market was how low the average DOM went as even those hard-to-sell homes attracted buyers.
As with the previous surge, the average DOM has sunk below 20 while the median DOM has revisited its all-time low of 4 days on the MLS.
(Note: These statistics are for residential listings in the metro Denver area, which I’ve defined here as within a 25-mile radius of the State Capitol.)
The rising cost of money — that is, the increase in mortgage rates projected for this year — will lure many buyers “off the fence” hoping a buy a home before interest rates rise further.
I foresee a stronger than usual seasonal jump in the number of new listings as spring arrives.
Many people believe, erroneously, that the best time to list a home is in the spring, so those people will be putting their homes up for sale in the coming weeks. In addition, as I wrote last week, many homeowners who weren’t thinking of selling before are likely to decide it’s a good time to “cash out.” But I don’t foresee that increase in supply going far to meet the needs of today’s home buyers, and I don’t see prices leveling off, much less declining.
It surprises many of us that homes are appraising at the high prices they are selling for, but when a winning bidder waives appraisal objection to win a bidding war — which is almost common nowadays — that sale becomes a comp that supports future appraisals at the same price or higher. (On the appraisal form, there’s a place to indicate a rising, falling or stable market, and when an appraiser checks the box that it’s a rising market, that gives him or her more leeway to appraise a home higher than recent comparable sales might otherwise justify, further fueling the frenzy.)
The real estate market is becoming less and less predictable, along with other elements of our economy and society. War could be imminent or a new Covid variant might come. God only knows!
The often heard complaint from homebuyers and their agents during the pandemic was the lack of active listings, which was not due to a lack of new listings but rather the result of those new listings going under contract so quickly that at any given time there were few to choose from.
It became a crazy sellers market which is only now abating except for “special” homes that are priced appropriately.
Looking only at closed listings, you might conclude that we are still in a sellers market. One measure I have used in the past is the median ratio of listing price to closing price, which remains above 100% within the Denver metro area. In September, for closings within 15 miles of downtown Denver, the median was 0.9% above listing price — declining, but still impressive.
However, if you look below the surface — that is, at the homes that haven’t sold, you see a rising inventory of homes that have been active on the MLS for an increasing length of time.
For example, as I write this column on Monday morning for this Thursday’s newspapers, there are 2,542 active listings of single family homes, condos and townhomes within 18 miles of downtown Denver, 760 of which (or 30%) were only listed on REcolorado in the last 7 days.
Despite so many new listings, the median active listing has been on the MLS for 19 days, and 1,024 of them (or 49.9%) have been active 30 days or longer. Another 552 of them (or 21.7%) have been active for 60 days or longer.
Meanwhile, there are 4,949 pending listings within that same 18-mile radius. Of them, only 804 or 16.2% were active more than 30 days before going under contract, and only 319 (or 6.4%) took over 60 days to go under contract. 221 of those currently pending listings went under contract with zero days on the MLS. Another 2,528 of them (over 50%) went under contract in 1 to 7 days.
Meanwhile, if you look at the 3,509 listings in the same 18-mile radius that closed in the last 30 days, only 401 of them (or 11.4%) took over 30 days to go under contract, and only 318 (or 3.4%) took over 60 days to go under contract.
This is what it looks like as we transition from a seller’s market to a balanced market. To reiterate, nearly 22%of active listings within 18 miles of downtown Denver have been on the market over 60 days, but only 3.4% of recently closed listings were active that long before going on the market.
My bottom-line observation is: Buyers who gave up after losing multiple bidding wars will find greater success if they re-enter the market now. As I’ve suggested in the past, you can avoid a bidding war simply by asking your agent to send only listings that have been active on the MLS for at least 10 days. You’re less likely to have competing buyers for them.
The new listings, however, will still get multiple offers if they are unique or special in one way or another.
For example, we recently listed a home in Golden’s coveted 12th Street Historic District. There was a bidding war on it, and it went under contract for more than $100,000 over the listing price. But if you look at all the active listings in Golden proper as I write this, there is only one new listing. The other active listings have been on the MLS between 11 and 102 days, and all but two of them have posted price reductions.
It should begin to sink in among sellers and their listing agents that they need to be less aggressive in pricing their homes when they put them on the market.
Don’t assume that buyers will flock to your listing regardless of price and compete with each other for it. Price it right, and it will sell. Overprice it, and it won’t.
This is my regular update on the real estate bidding wars.I was planning to do this analysis next week, but I’ve observed a definite slowing of the market, so I moved my report to this week, analyzing the closings that occurred last Thursday, July 1st, to see how the bidding wars have evolved since my last report. To my surprise, this analysis shows only a slight slowing, likely because those listings went under contract 30-45 days earlier.
As I did in previous months, I limited my analysis to sales within a 15-mile radius of downtown Denver. I limited my search to homes, condos and townhouses that were on the MLS at least one day but not more than 6 days before going under contract, since those are the homes with bidding wars. Once again I divided the results into listings which sold for up to $500,000 and those that sold for more.
On July 1st there were 33 closings up to $500,000, compared to 40 such closings on June 10th. The median home sold for 5.9% over its asking price, compared to 6.3% on June 10th. The highest ratio this time was 20% for a bungalow in Aurora compared to 19.6% on June 10th for a condo in Golden. Four listings sold for the asking price, and three sold for less than listing price, compared to none on June 10th.
There were 44 homes that closed on July 1st for more than $500,000, compared to 37 homes on June 10th. The median home in that group sold for 7.4% over its listing price, compared to 7.7% on June 10th. Only one sold for the listing price, and not one home sold for less than the listing price. The highest overbid was 29.7% for a contemporary 1969 home on Lookout Mountain, compared to 20.9% on June 10th.
To have a statistically significant number of closings over $1 million, I analyzed the 123 closings between June 16th and July 1st. The median closing for those high-end homes was 5.7% over listing price, compared to 6.1% from June 1-13. Fifteen homes sold for the listing price and 9 homes sold for less than the listing price. The highest overbid was for a 1985 home in “The Ridge” south of downtown Littleton which was listed at $900,000 and sold in five days for $1,200,000, 33.3% over listing price.
Note: 27 of the 123 homes that sold for over $1 million were listed for under $1 million.
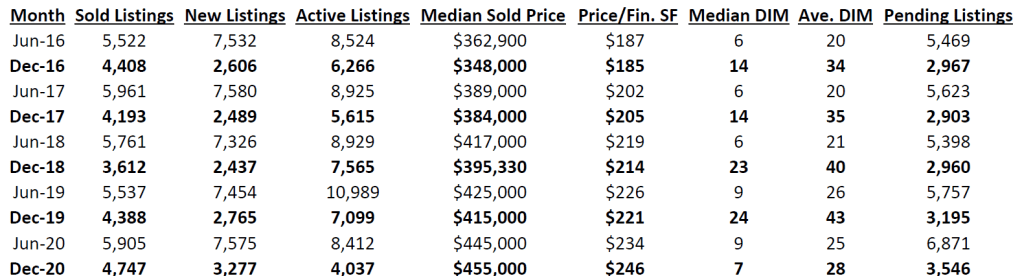
The chart below is a compilation of various market indicators for the Denver metro area, which I am defining as a 25-mile radius of the State Capitol. There are some surprising differences this December from previous Decembers to be discerned from looking at that chart. I have included June figures but put the December stats in bold type to make it easier to compare summer vs. winter statistics over the last five years.
Source: REcolorado
Historically, one would expect to see more sold listings, new listings and active listings in June than in December, and that trend held true in 2020, but the numbers for this December broke some new ground.
The number of sold listings and new listings were at record highs for a December, leaving the number of active listings at a record low. There has been lots of talk about how low our active inventory is, but, as I’ve written before, that’s not for lack of new listings but rather how quickly buyers are snapping up new listings.
The strength of this sellers’ market becomes more evident when you look at the other columns. In past years, the median sold price in December was substantially lower than it was in June, but the opposite was true this year, rising to a record $455,000. Correspondingly, the average price per finished square foot surged above June’s number to a record $246, and the median days in the MLS (“DIM”) plunged from last December’s 24 to just 7 days this December — even lower than the DIM for June 2020. The average DIM of 28 is more typical of summer months than winter, reflecting the fact that even homes that had been languishing on the market (because they were overpriced) were selling at a faster clip last month. Indeed 22% of the listings sold were on the MLS for over 30 days. Of those, 5.8% were active over 90 days, and 3.4% were active for more than 120 days. Those older listings are responsible for raising the average DIM.
Because of the well-publicized migration away from densely populated areas because of Covid-19, I was curious to learn whether single-family detached homes represented a higher percentage of the closings this December, compared to December 2019, but in fact the percentage dropped a little this year — 66.7% this year vs. 69.5% last year. The same was true in June, when the pandemic was already raging and we believed that people were fleeing condos for detached single-family homes. This is counterintuitive, and I can offer no theory to explain it, but I have more to say about this topic below.
Another measure of the strength of the current sellers’ market is how many homes sold above their asking prices. With December 2019’s days in MLS number so high (24), one hardly needs to ask, but here are the numbers. This December, 16.6% of the listings sold for their full listing price, and 42.2% sold above their listing price. Last year, those numbers were dramatically lower. While 15.8% sold for their full listing price, only 15.9% of listings sold above their listing price in December 2019.
So, what’s the prognosis for 2021? January is positioned to have a record number of closings, considering that there are a record number of pending transactions left over from December, as shown in the chart. With mortgage interest rates projected to remain at record lows — currently at or below 3% — there is a strong incentive for buyers to keep buying. Another factor favoring buyers is the movement of service sector jobs towards working from home.
To measure that trend, I compared the December-over-December sales in Downtown Denver, part of Capitol Hill and the Golden Triangle (specifically, a 1.2-mile radius from 20th & Arapahoe Streets in downtown Denver) and found there were 63 sales in December 2019 compared to 77 sales in December 2020. Meanwhile, there were 272 active listings in December 2019, but that surged to 444 active listings in December 2020. It’s a buyer’s market there.
In that same area, the days in MLS dropped from 43 days last December to 32 days this December (way higher than the 24 days vs. 7 days for the 25-mile radius in the above chart), but the median sold price plunged from $535,000 in December 2019 to $480,000 in December 2020. Compare that to the $40,000 increase in median sold price with the larger metro area, as shown in the above chart.
So, yes, it is still harder to sell a home in the densely populated central Denver area, and there is definitely an out-migration taking shape, but it’s still too early to call it an exodus.
Note: All these statistics were compiled from REcolorado, Denver’s MLS, excluding listings from other MLSs which are displayed on REcolorado.com. Often those listings from other MLSs are merely duplicates of REcolorado’s own listings, so I excluded them.