A contract on one of my listings fell on inspection last week, but the buyer would not say why and would not release the inspection report. Meanwhile, the inspector had met the seller during the inspection and expressed shock when told that the contract was terminated. The logical conclusion was that the contract fell due to buyer’s remorse, i.e., a change of mind about buying the home.
The buyer and their agent could have simply stated that, because it’s a perfectly valid reason for terminating under the inspection contingency. It practically says as much in the contract itself. (By the way, the home quickly went under contract again with a new buyer.)
The seller asked me how common buyer’s remorse terminations are, given the way buyers are being rushed into making purchase decisions (at inflated prices) due to bidding wars.
So I did some research and found that contracts are not falling at a statistically significant higher rate than they did, say, two years ago during the same week.
Here are the specifics from my research on REcolorado.com:
Of the 100 highest priced closings in early July that were on the market 1 to 20 days, 8% had a contract fall before a successful closing. During the same time period in 2019, 7% listings had a fallen contract before their successful closing.
Of the 100 lowest priced closings in early July that were on the MLS 1 to 20 days, 15%had a contract fall, compared to the same time period in 2019, when 16%had a contract fall before a successful closing.
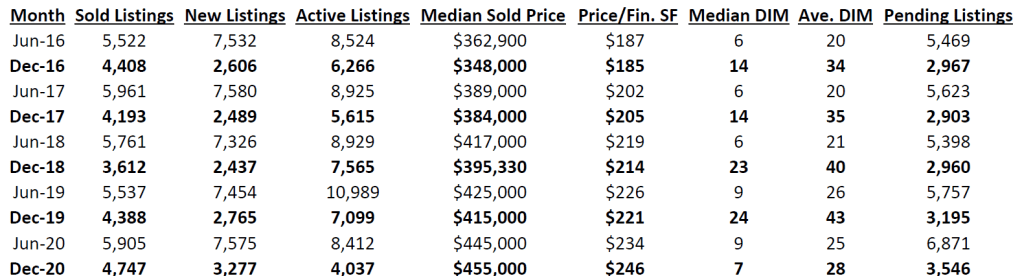
The chart below is a compilation of various market indicators for the Denver metro area, which I am defining as a 25-mile radius of the State Capitol. There are some surprising differences this December from previous Decembers to be discerned from looking at that chart. I have included June figures but put the December stats in bold type to make it easier to compare summer vs. winter statistics over the last five years.
Source: REcolorado
Historically, one would expect to see more sold listings, new listings and active listings in June than in December, and that trend held true in 2020, but the numbers for this December broke some new ground.
The number of sold listings and new listings were at record highs for a December, leaving the number of active listings at a record low. There has been lots of talk about how low our active inventory is, but, as I’ve written before, that’s not for lack of new listings but rather how quickly buyers are snapping up new listings.
The strength of this sellers’ market becomes more evident when you look at the other columns. In past years, the median sold price in December was substantially lower than it was in June, but the opposite was true this year, rising to a record $455,000. Correspondingly, the average price per finished square foot surged above June’s number to a record $246, and the median days in the MLS (“DIM”) plunged from last December’s 24 to just 7 days this December — even lower than the DIM for June 2020. The average DIM of 28 is more typical of summer months than winter, reflecting the fact that even homes that had been languishing on the market (because they were overpriced) were selling at a faster clip last month. Indeed 22% of the listings sold were on the MLS for over 30 days. Of those, 5.8% were active over 90 days, and 3.4% were active for more than 120 days. Those older listings are responsible for raising the average DIM.
Because of the well-publicized migration away from densely populated areas because of Covid-19, I was curious to learn whether single-family detached homes represented a higher percentage of the closings this December, compared to December 2019, but in fact the percentage dropped a little this year — 66.7% this year vs. 69.5% last year. The same was true in June, when the pandemic was already raging and we believed that people were fleeing condos for detached single-family homes. This is counterintuitive, and I can offer no theory to explain it, but I have more to say about this topic below.
Another measure of the strength of the current sellers’ market is how many homes sold above their asking prices. With December 2019’s days in MLS number so high (24), one hardly needs to ask, but here are the numbers. This December, 16.6% of the listings sold for their full listing price, and 42.2% sold above their listing price. Last year, those numbers were dramatically lower. While 15.8% sold for their full listing price, only 15.9% of listings sold above their listing price in December 2019.
So, what’s the prognosis for 2021? January is positioned to have a record number of closings, considering that there are a record number of pending transactions left over from December, as shown in the chart. With mortgage interest rates projected to remain at record lows — currently at or below 3% — there is a strong incentive for buyers to keep buying. Another factor favoring buyers is the movement of service sector jobs towards working from home.
To measure that trend, I compared the December-over-December sales in Downtown Denver, part of Capitol Hill and the Golden Triangle (specifically, a 1.2-mile radius from 20th & Arapahoe Streets in downtown Denver) and found there were 63 sales in December 2019 compared to 77 sales in December 2020. Meanwhile, there were 272 active listings in December 2019, but that surged to 444 active listings in December 2020. It’s a buyer’s market there.
In that same area, the days in MLS dropped from 43 days last December to 32 days this December (way higher than the 24 days vs. 7 days for the 25-mile radius in the above chart), but the median sold price plunged from $535,000 in December 2019 to $480,000 in December 2020. Compare that to the $40,000 increase in median sold price with the larger metro area, as shown in the above chart.
So, yes, it is still harder to sell a home in the densely populated central Denver area, and there is definitely an out-migration taking shape, but it’s still too early to call it an exodus.
Note: All these statistics were compiled from REcolorado, Denver’s MLS, excluding listings from other MLSs which are displayed on REcolorado.com. Often those listings from other MLSs are merely duplicates of REcolorado’s own listings, so I excluded them.
You’ve got maybe 5 seconds to read the small print…
Nothing has surprised us real estate professionals quite as much as how hot the market has been during the Covid-19 pandemic. Redfin, the brokerage with what I consider misleading TV ads, did an analysis of offers written by their own agents on MLS listings and found that over half of those offers faced competing offers from other agents.
Nationwide, the percentage of Redfin offers facing competition was 53.7% in June, up from 51.8% in May and 44% in April. Boston led the pack with 72.4% of offers facing competition during June, up from 67.2% in May.
The Denver market came in 12th nationally in terms of bidding wars, with 53% of offers facing competition, down from 55.6% in May. Of the top 12 metro areas, only Denver and Portland had lower percentages in June than in May.
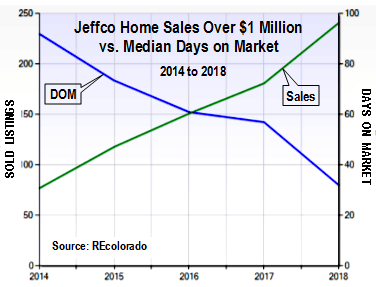
We Realtors are as surprised as anyone at the increase in home values, especially of the most expensive homes. The charts below speak for themselves. Not only are sales of million-dollar homes in Denver and Jefferson County increasing, but the time it takes such homes to go under contract has continued to go down.
Not shown in these charts is 2019, since we’re only 9 months into the year, but the number of sales for both counties thus far in 2019 is already about to surpass the sales for all of 2018, and the median days on market (DOM) is about the same as last year. Evidently, the number of sales over $1 million will continue to increase, while the days-on-market line may level off.
The number of sales of Denver homes over $1 million thus far in 2019 is 739, vs. 746 for all of 2018. The yearly increase in million-dollar closings has ranged from 9.2% to 40% over the past 5 years.
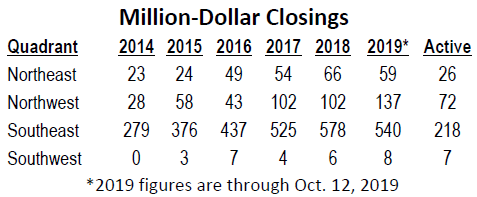
Those are the statistics for all of Denver. The figures for Denver’s four quadrants (divided from each other by Colfax and Broadway) present differing market trends, as follows:
It’s worth noting that two of the quadrants — northwest and southwest Denver — have already recorded a big increase in sales for 2019 over all of last year. And the other two quadrants are likely to top last year’s sales, since there are currently enough homes under contract to make that happen. At press time there were 125 Denver homes over $1 million under contract — 78 in southeast Denver and 13 in northeast Denver, most of which can be expected to close in coming weeks. There are another 323 active Denver listings over $1 million, many of which could also sell by year’s end.
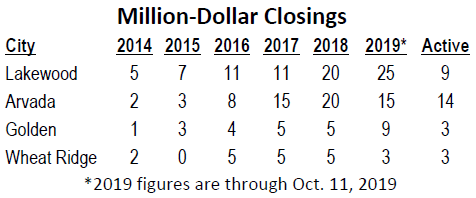
The number of Jefferson County homes over $1 million sold in 2019 through press time was 235, vs. 242 for all of 2018. The yearly increase in million-dollar closings has ranged from 21% to 53% over the past 5 years. Those, however, are the statistics for all of Jefferson County. The figures for the four biggest Jeffco cities present differing market trends, as follows (Note: Golden stats are within city limits only):
Only Wheat Ridge is lagging in this trend of massively increased sales of Jeffco homes for over $1 million. The other three cities are beating the county trend. The days on market for these four cities varied significantly from each other and from the Jefferson County statistics.
For example, those five sales last year of million-dollar homes in Wheat Ridge had a median DOM of 298, while the 20 homes that sold last year in Lakewood had a median DOM of 25 and the 5 homes that sold in Golden had a median DOM of 89. The Arvada homes had a median DOM of 21 days. The 15 Arvada homes that have sold thus far in 2019 have a median DOM of just 14 days.
While the market for lower-priced homes does show signs of slowing, the market for homes over $1 million seems only to be strengthening. This may be a reflection of the Trump tax cuts which are known to have helped the ultra rich more than those in lower income brackets. That discrepancy has also evidenced itself in the rates for jumbo loans, which have been lower in recent years than the rates for conventional mortgages. When I checked on Sunday, Wells Fargo was quoting jumbo loans at 3.5% and conventional loans at 3.625%.
There’s a lot of uncertainty in the world right now, especially in the Middle East and on the domestic political scene, and I’m frankly surprised that the markets remain so stable. It will be interesting to see how things shake out in the coming months and how that impacts the real estate market.