

The chart below is a compilation of various market indicators for the Denver metro area, which I am defining as a 25-mile radius of the State Capitol. There are some surprising differences this December from previous Decembers to be discerned from looking at that chart. I have included June figures but put the December stats in bold type to make it easier to compare summer vs. winter statistics over the last five years.
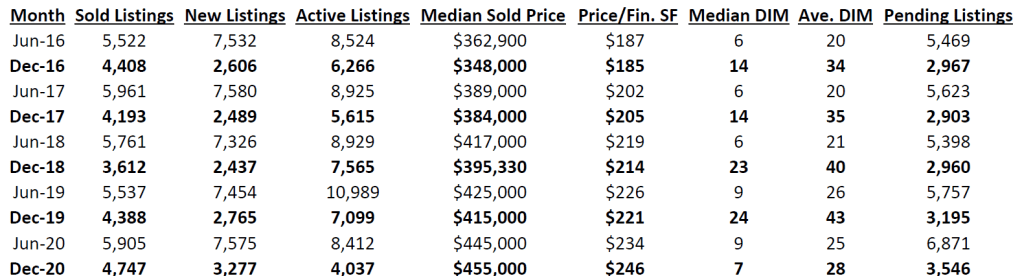
Historically, one would expect to see more sold listings, new listings and active listings in June than in December, and that trend held true in 2020, but the numbers for this December broke some new ground.
The number of sold listings and new listings were at record highs for a December, leaving the number of active listings at a record low. There has been lots of talk about how low our active inventory is, but, as I’ve written before, that’s not for lack of new listings but rather how quickly buyers are snapping up new listings.
The strength of this sellers’ market becomes more evident when you look at the other columns. In past years, the median sold price in December was substantially lower than it was in June, but the opposite was true this year, rising to a record $455,000. Correspondingly, the average price per finished square foot surged above June’s number to a record $246, and the median days in the MLS (“DIM”) plunged from last December’s 24 to just 7 days this December — even lower than the DIM for June 2020. The average DIM of 28 is more typical of summer months than winter, reflecting the fact that even homes that had been languishing on the market (because they were overpriced) were selling at a faster clip last month. Indeed 22% of the listings sold were on the MLS for over 30 days. Of those, 5.8% were active over 90 days, and 3.4% were active for more than 120 days. Those older listings are responsible for raising the average DIM.
Because of the well-publicized migration away from densely populated areas because of Covid-19, I was curious to learn whether single-family detached homes represented a higher percentage of the closings this December, compared to December 2019, but in fact the percentage dropped a little this year — 66.7% this year vs. 69.5% last year. The same was true in June, when the pandemic was already raging and we believed that people were fleeing condos for detached single-family homes. This is counterintuitive, and I can offer no theory to explain it, but I have more to say about this topic below.
Another measure of the strength of the current sellers’ market is how many homes sold above their asking prices. With December 2019’s days in MLS number so high (24), one hardly needs to ask, but here are the numbers. This December, 16.6% of the listings sold for their full listing price, and 42.2% sold above their listing price. Last year, those numbers were dramatically lower. While 15.8% sold for their full listing price, only 15.9% of listings sold above their listing price in December 2019.
So, what’s the prognosis for 2021? January is positioned to have a record number of closings, considering that there are a record number of pending transactions left over from December, as shown in the chart. With mortgage interest rates projected to remain at record lows — currently at or below 3% — there is a strong incentive for buyers to keep buying. Another factor favoring buyers is the movement of service sector jobs towards working from home.

To measure that trend, I compared the December-over-December sales in Downtown Denver, part of Capitol Hill and the Golden Triangle (specifically, a 1.2-mile radius from 20th & Arapahoe Streets in downtown Denver) and found there were 63 sales in December 2019 compared to 77 sales in December 2020. Meanwhile, there were 272 active listings in December 2019, but that surged to 444 active listings in December 2020. It’s a buyer’s market there.
In that same area, the days in MLS dropped from 43 days last December to 32 days this December (way higher than the 24 days vs. 7 days for the 25-mile radius in the above chart), but the median sold price plunged from $535,000 in December 2019 to $480,000 in December 2020. Compare that to the $40,000 increase in median sold price with the larger metro area, as shown in the above chart.
So, yes, it is still harder to sell a home in the densely populated central Denver area, and there is definitely an out-migration taking shape, but it’s still too early to call it an exodus.
Note: All these statistics were compiled from REcolorado, Denver’s MLS, excluding listings from other MLSs which are displayed on REcolorado.com. Often those listings from other MLSs are merely duplicates of REcolorado’s own listings, so I excluded them.

The data on median prices reaching record highs is very interesting.
LikeLike