February Statistics Show Some Stabilization of Metro Denver’s Real Estate Statistics

Below is the “Market Overview” for February as published by the Market Trends Committee of the Denver Metro Association of Realtors (DMAR). It is for the 11-county “metro” area, which includes Elbert, Gilpin and Park counties.

One statistic omitted from the DMAR infographic is the median days in MLS, which fell dramatically compared to the average days in MLS. Defining metro Denver as a 23-mile radius of downtown Denver (not how DMAR chooses to define it), I find the average days-in-MLS for February to be 47 (up from 46 days in January) and the median days-in-MLS to be 24 (down from 34 days from January).

(Notably, the days-in-MLS statistics for the first several days of March are 39 and 13 respectively. We’ll check back in April to see how those statistics for March end up.)

That’s an important distinction, because what it tells us is that while there continue to be lots of overpriced homes sitting on the MLS, there are now enough right-priced homes on the MLS which are selling quickly to bring down the median days-on-MLS statistic.

This is a lesson which all sellers should take to heart — that if you price your home at or slightly below the market, you will sell your home quickly, but if you put it on the MLS at a hoped-for price that is above the market, it will sit on the MLS for a long time.

As I write this on Monday evening, these are the numbers of active Denver metro listings on www.REcolorado.com listed by days-on-market:

0-7 Days—610

8-14 Days—306

15-31 Days—478

32-60 Days—442

61-90 Days—193

Over 90 Days—743

We agents refer to listings that have been on the MLS over 30 or 60 days as “stale,” and those are good prospects for getting a low-ball offer accepted. Buyers can certainly be confident that they won’t encounter a bidding war for any listing that has been on the market more than a couple weeks — unless there was a recent price reduction. If you want to avoid bidding wars and get a good deal, ask your agent to send you only listings which have been on the MLS over 10 days.

Meanwhile, sellers need to recognize that if they overprice a home and later reduce the price to make it sell, they typically get less than if they had priced the home correctly.

For Jefferson County residents, here is the above analysis as it relates to Jeffco:

These are the numbers of active Jeffco listings on REcolorado by days-on-market:

0-7 Days—150

8-14 Days—62

15-31 Days—92

32-60 Days—82

61-90 Days—25

Over 90 Days—141

Here are the charts adapting that DMAR graphic to Jefferson County:

Have You Wondered About 72Sold? It’s Not Licensed as a Real Estate Brokerage in Colorado

Perhaps, like me, you have wondered about 72Sold, which runs commercials every night on local TV stations, giving the impression that it is a Colorado real estate brokerage, and directing you to www.72Sold.com, which gives the same impression.

In researching this company, the first thing I did was to look on REcolorado.com, the Denver MLS, to see how many listings they have sold. The answer was none, because 72Sold is not a member of the MLS and is not even licensed in Colorado to sell real estate.

So what’s the story? First I asked Marcia Waters, director of the Colorado Division of Real Estate, who confirmed that 72Sold is not licensed in Colorado, and said the division has not received any complaints about them — which makes sense, since one can only file a complaint against a licensed brokerage.

My suspicions about 72Sold were raised further as I scanned the company’s website, which contains numerous testimonials and the following graphic, which has no identification of, or links to, the “five independent studies” cited in it:

To learn more, I posed as a potential seller and requested a valuation on 72Sold’s website, which uses such terminology as “a better way to sell your home.” That sure sounds like a brokerage, doesn’t it?

Registering my name and a home address on their website resulted in a call from a woman who said she was from 72Sold but who, under questioning, said she was actually with Your Castle Realty, a non-Realtor brokerage. So as not to blow my cover, I used the excuse that I only wanted to work with a Realtor, and she offered to have an agent from Keller Williams call me.

Susan Thayer, co-owner with her husband of Keller Williams Action Realty in Castle Rock, was the agent who called me next. I revealed to her that I was actually a Realtor myself writing this real estate column. I explained that posing as a seller on 72Sold’s website was the only way I could find out what was really behind all those TV commercials.

Susan was quite open and helpful and sent me links with background information, including an Inman News article about 72Sold’s partnership with Keller Williams and its many franchises.

Like 72Sold’s website, the Inman story conflated the roles of a lead generating company and a real estate brokerage, reporting, for example, that 72Sold had grown from 10 agents to 426 agents (as of August 2022), when in fact they only have licensed agents in Arizona, where they are a licensed brokerage.  Everywhere else, as I understand it, they have what should be called “referral partners” instead of agents.

What 72Sold does is invest 80% of its referral fee income (according to the Inman story) into more TV advertising in those markets where it has referral partners, and some of that expense is apparently shared by those referral partners, although I didn’t garner any specific numbers.

What 72Sold offers through its referral partners is a strategy of combining a 7-day coming soon period with a Friday-to-Sunday active period during which buyers’ agents may show the home for 15 minutes on Saturday, according to the Inman article. The idea is to create a buyer frenzy and “fear of loss.” With the slowing of the market, that strategy has softened. It sounds great to sellers, however, making the leads generated well worth 72Sold’s referral fee.

Click on the thumbnail below to watch a video from 72Sold’s home page. Judge for yourself whether they are posing as a brokerage in Colorado, where you just watched their TV ad.

PS: It is a violation of the Realtor Code of Ethics for a member to misrepresent himself or his level of success, but neither Greg Hague nor his Arizona brokerage is a member of the National Association of Realtors, and therefore neither is bound to the Code of Ethics.

Fannie Mae Requires Appraisers to Use a Measurement Model for Square Footage Not Used by Realtors

How we measure the gross living area of a home is important, but there is little consistency. Different websites may use different numbers for the same home, primarily because they tend to have only one field for square footage.

Below, I’ll write about Fannie Mae’s new rules for measuring homes, but it’s up to each real estate website operator which number it uses for square footage. For example, the web page that we create for each Golden Real Estate listing has only one square footage field, so I choose to display finished square footage. The MLS has fields to distinguish between finished, unfinished, basement, above-grade, and total square feet, as shown below, and all those fields are uploaded to every consumer website, but I haven’t found any consumer website which displays all those fields.

Zillow is an example of a website which features only the total square footage in each listing, even if half that area is unfinished basement space. It doesn’t show the breakdown of finished vs. unfinished space or basement vs. above-grade space unless you click on a link titled “See more facts and features.”

Trulia, which is owned by Zillow, has a link “See all” which lists “finished area” if you scroll down far enough, but that’s all. I find this ironic, because both Trulia and Zillow provide a ton of information not found on the MLS, yet they downplay or omit the most important detail of all — the breakdown of square footage.

Redfin, which, like Trulia and Zillow, gets the full feed from our MLS, also features only the total square feet and has no link that I could find which displays a breakdown. And, like both Trulia and Zillow, Redfin prominently features “price per square foot,” but that figure is based on the total square feet, which can be really misleading.

Golden Real Estate’s website, like those three, gets its active listings from the MLS, but our display is managed by the MLS, and all listings on our website use the finished square footage number, which is, I believe, the most useful single number to use. But, once again, there’s only one field for displaying square footage.

The MLS has its own consumer-facing website, www.REcolorado.com, where you can search for listings. On that site, the total square footage is featured, but scroll down and you see this very thorough breakdown of square footage:

On other websites, you’d only see 3,166 square feet and $271/sq. ft. for the listing in this example.

The numbers  displayed on the MLS are entered by the listing agent. Our sole obligation in providing them is to indicate the source. It could be from public records, or it could be from a prior appraisal. We could also measure it ourselves, but that is really unlikely. The only requirement is that we disclose the source. The safest choice is public records, but those numbers could be wrong.

Fun fact: Square footage of a home, by whatever standard, is measured from the outside of the exterior walls, not the inside.

Lenders, of course, want to know that the square footage is accurate and consistent, so recently Fannie Mae mandated that all appraisers follow the ANSI (American National Standards Institute) standard, which can result in appraisals which come up with different numbers than in the MLS listing on which the buyer relied.

The ANSI standards don’t allow for space with ceiling heights under 7’ to be included in the gross living area, and the square footage of staircases can only be counted on the level from which the staircase descends. Also, if even part of a level is below grade, the entire level has to be counted as “basement,” which directly conflicts with MLS rules which say the lower level of a bi-level or tri-level home (which is at least partially below grade) can be counted as above-grade square footage.

Complicating matters, appraisers must measure properties using the ANSI standards, but they have no choice but to rely on MLS measurements for the comps they cite in an appraisal, which were surely not done to ANSI standards. The technical term for this is “apples and oranges…”

There are three different square footage numbers for every MLS listing, and here is a quick tutorial on REcolorado’s rules for measuring square footage.

Above-Grade square footage used to be called “Main” square footage. As the new name suggests, it does not include basement square footage.  But that begs the question, “what is a basement?”  In a split-level home, the lower level, which is often below grade, is included in the “above-grade” square footage, since there is frequently a basement below that level. In a “raised ranch” home, the lower level is included in “above-grade” square footage for the same reason. (A “raised ranch” is defined as a home where you have to climb a flight of stairs to get to the “main” level. The “main” level is defined as the level containing the kitchen.) 

Finished square footage includes all the finished square feet, whether in the basement or above-grade. If the basement is unfinished (or there is no basement), this number will be the same as the “Above Grade” number.

Total square footage is what the name suggests, whether finished or unfinished.

All three of these numbers will be different when a listing has a partially finished basement.

Experts Differ on What 2023 Will Bring in Terms of the Real Estate and Mortgage Markets

Real estate and mortgage professionals are coming to grips with how the market changed in 2022, but they’re holding back on predictions for the market in 2023.

On the national level, Lawrence Yun, NAR chief economist, predicts home prices will remain stable and the sales of existing homes will decline by 6.8%. He identified ten markets that will outperform other metro areas, and all ten of them are in the southeast.

“Half of the country may experience small price gains, while the other half may see slight price declines,” Yun said.

Here in the Denver market, the Denver Metro Association of Realtors (DMAR) issues a monthly market trends report. In its latest report, it pointed out that while there is a steady month-over-month decline in the average sold price, the year-over-year sold prices remain higher.

“Without a doubt, the Denver Metro housing market is changing, but the question on everyone’s mind is how long this change will last and what to expect next year,” commented Libby Levinson-Katz, Chair of the DMAR Market Trends Committee and a metro Denver Realtor®. “Most of the answers are tied directly to when we will see relief from increasing mortgage rates that have more than doubled since January… While we expect to see the Denver real estate market continue to change through 2023 due to interest rates and inventory woes, it has continued to show strength and stability.” 

As I highlighted above, a lot depends on the direction of mortgage rates, and predictions of where rates are headed are few and varied, because there are so many factors.

For example, will the Federal Reserve’s increases in the Fed Funds rate continue, and for how long? Will it cause a recession? Will unemployment increase and inflation abate?  What’s the future of the war in Ukraine and its impact on the US and world economy? What will energy cost in 2023?

Personally, I have no predictions to offer. What I know for sure is that people will still want to sell, and there will always be buyers ready to buy. We continue to see new listings come on the market. As always, some listings will be priced wisely and will sell quickly, but most will be overpriced and will sit on the market, slowly reducing their prices until they sell, expire, or are withdrawn from the MLS.

There may even be bidding wars on homes that are priced right. For example, I just sold a home in Applewood which we priced at $895,000 and sold to one of three bidders within a week for over $900,000. But we’re not perfect. Other listings have languished on the market and only sold once we reduced the price sufficiently to attract a buyer.

The New Sellers Property Disclosure Is a Great Improvement

Every few years, the Division of Real Estate releases a revised Sellers Property Disclosure to be used by real estate brokers. A forms committee suggests revisions which then must be approved by the Colorado Real Estate Commission.

I wasn’t a big fan of the version which was released in 2018, but I’m a big fan of the one which is mandatory beginning on January 1, 2023. There are disclosures for each type of property. In this blog post, I’ll only talk about changes to the one for residential listings. Here’s a link to it, which you will need to download to scroll through it.

Some of the changes are subtle — for example, the seller is told to disclosure adverse materials facts instead of defects. That makes sense, since there was no definition of “defect” in the 2018 version.

Other changes are more substantive. For example, instead of just asking if the property is in an HOA, it asks for the name of the association(s) and contact information for each. If the neighborhood has cluster mailboxes, it asks for the location and number of the mailbox.

At the top of the form, it asks when the seller acquired the property, not only the year it was built as in the 2018 form. It also asks the seller to attach any reports, receipts or other documents “you believe necessary for the information you provide to be complete.” There was no such request in the prior version.

The seller is asked whether the home is subject to deed restrictions or affordable housing restrictions, and whether it is in a historic district. This is new.

Another sign of the times is that instead of asking if there is or has been tobacco smoke, it refers only to “smoking” and adds in parentheses “including in garages, unfinished space, or detached buildings.”

Under “Access and Parking,” the form asks if there are any limitations on parking or access due to size, number and type of vehicles. Instead of asking if there are “any access problems,” it asks the broader question of whether there are “access problems, issues or concerns.” Those three words are used elsewhere to expand on the question of “problems.”

In the section on “Use, zoning and legal issues,” instead of asking simply whether any additions or alterations have been made, it specifies whether they were made with a building permit and without a building permit, including “non-aesthetic alterations,” which is undefined. It also asks whether the property has been used for short-term rentals in the past year and whether there are “grandfathered conditions or uses.”

Under “Sewer,” the form asks for the name of the sewer service provider, the date of the last sewer scope, the date of the last septic use permit, inspection, and pumping — all useful information.

In the “Water” section, the form asks for the location of the water shutoff.  If there’s a well, it asks the date of the last inspection and service.  It asks the gallons per minute (GPM) of the well as of a specified date, and it asks the size in gallons of any cistern. Lastly, it asks whether the seller purchased any supplemental water in the last two years — an indication of the well’s adequacy.

The form asks the seller to identify the electricity, cable TV and internet service providers.

The instructor of the class I took regarding these new contracts and disclosures reminded us that the sellers property disclosure is to be accurate as of the date the home goes under contract. Therefore, if the property goes under contract after Dec. 31, 2022, this new form must be completed by the seller, but it does not need to be replaced if the listing is already pending but does not close until 2023.

That led me to adopt a new “best practice” which I’ll share here with my fellow listing agents. Instead of having the seller complete and sign the sellers property disclosure when I list the home, my practice henceforth will be to have the seller complete the document at the time of listing but to review and sign it only after going under contract with a buyer, thereby assuring that it is accurate as of the purchase contract date, as stated on the disclosure.

DMAR’s Metro Area Statistics Cover 11 Counties

What do the rural cities and towns of Kiowa, Agate, Simla, Fairplay, Georgetown, Empire, Black Hawk, Rollinsville, Nederland, Allenspark, Lyons, Longmont, and Bennett have in common?  They’re all included in the Denver metro area statistics compiled monthly by the Denver Metro Association of Realtors for its market trends report. Here is a map of the 11 counties included in that report.

REcolorado, the Denver MLS, allows infinite flexibility in drawing the boundaries when searching for listings or doing statistical analysis, so my preference is always to draw a radius of 20 miles from downtown Denver when compiling metro statistics.

Below is this month’s infographic from DMAR showing the November month-over-month statistics for their 11-county “metro area.”

Under all five elements of the infographic I have inserted the same November statistics for the 20-mile radius of downtown Denver that I prefer to use.

The variations this month are not as great as I have seen in some months.

NAR’s Annual Survey of Buyers and Sellers Shows Big Deviations From Past Years

 Every year the National Association of Realtors (NAR) surveys buyers and sellers of primary residences on a variety of topics. Usually, the changes from one year to the next are fairly minor, but the most recent survey (covering the period from July 2021 through June 2022) produced some big statistical deviations from prior years. Here are some of the findings that stood out to me.

1)   The percentage of first-time buyers dropped to a record low of just 27%, beating the previous record low of 30% in 1987 — 35 years ago! In the 2020-2021 survey it was 34%. The average age of first-time buyers jumped from 33 to 36. The average age of repeat buyers also rose — from 56 to 59.

2)   88% of all buyers were White, the highest percentage since the 1990s. Meanwhile, the percentage of buyers who were Black and Asian/Pacific Islander both dropped by half, from 6% to 3%. The percentage of buyers who were Hispanic/Latino rose slightly from 7% to 8%.

3)  Buyers moved an average of 50 miles from where they lived before, up from 15 miles the prior year, which was as high as it had been since at least the 1980s. (See chart below.) So, where did they move? Suburbs took a big hit, plunging from 51% to 39%, while rural and small town destinations jumped by half — 12% to 19% for rural areas and 20% to 29% for small towns. The NAR survey attributes that change to the pandemic’s effect of encouraging work from home. “Zoom towns were boom towns.”

4)   While only 3% of first-time buyers paid cash for their homes, 27% of repeat buyers paid cash, up from 17% the prior year. The survey attributes this to the surge in equity which homeowners had experienced in recent years, especially during the pandemic, providing them with lots of cash to spend on their replacement homes.

5)  How long buyers expect to remain in the home they just purchased had held steady since 2009 at 15 years for repeat buyers and 10 years for first-time buyers. The NAR survey showed a huge jump in that expectation for first-time homebuyers — from 10 years to 18 years. The expectation of repeat buyers remained unchanged at 15 years.

6)   The percentage of first-time buyers who had been renters plunged from 73% to 64%, while the number who moved from living with family or friends jumped from 21% to 27%. (See chart below.)

Click here to view the full summary of NAR’s 2022 survey of buyers and sellers.

Thanksgiving 2022 – In Spite of Everything, Much to Be Thankful for

First of all let me thank The Denver Post for making it possible for me to reach its many readers for well over a decade in this YourHub ad. I estimate that we get 90% of our real estate business from people who read this column and are inspired to contact us when they have a real estate need. Although we pay for this ad and for its placement on page 3 — the best ad location in any newspaper — they don’t need to sell it to us, and I thank them for letting me advertise here.

The feedback I get from many readers is that this is the first place they turn to when they receive this newspaper. What a great compliment that is, so my second “thanksgiving” is to you, my readers for following this column each week and thinking to call us when you have a real estate need. You can count on me to continue writing this column week after week and year after year so long as The Denver Post keeps it affordable!

By the way, should you move or stop subscribing to this newspaper, remember that I send it by email to over 1,400 subscribers (free, of course), and I would be happy to add you to that list.

Next, I am thankful to Golden Real Estate’s broker associates who continue to excel in serving our clients year-round. They share their commission earnings with the brokerage, of course, but are compensated for that    in various ways, including having their listings featured in this ad and being themselves promoted at the bottom of each week’s ad. They are all excellent Realtors who share our company’s values, an example of which is that the majority of them drive Tesla cars! I am blessed that they choose to be associated with Golden Real Estate and am happy to share with them many of the leads which come to me from readers of this column.

(By the way, we welcome applications from other licensed agents, as long as they share our values and are Realtor members.)

One of the unexpected secrets to Golden Real Estate’s success has been my personal outspokenness politically, which has meant disparaging former President Trump and his MAGA allies in my Talking Turkey column. There was initially some concern that we would lose business, but the opposite has been true. Readers who have appreciated my political stand have chosen Golden Real Estate as their brokerage because of my writings. The gained business has far outweighed the lost business, which I hope inspires other Realtors and brokerages to be less shy about sharing their patriotic beliefs, whether left or right. As citizens, let’s put country before self, however that looks.

In that regard, I am especially thankful for the results of the midterm elections.  And I’m guessing that next year I’ll be thankful that Donald Trump has entered the 2024 presidential race. May he do even more damage to the MAGA cause that he has already done!  More importantly, however, may his candidacy contribute to the revival of the mainstream Republican Party,  re-earning its designation as the “Grand Old Party.” That was the party of my father, and I miss it!

As always, I continue to be thankful for the contribution made by the National Association of Realtors (NAR) to protecting and promoting home ownership and the real estate industry. Only half of licensed real estate agents pay dues to NAR through their local Realtor association, but NAR continues to serve the entire industry as well as the general public by lobbying against negative legislation and government regulation on both the national and state level. Thank you, NAR!

I am grateful, too, to the Golden Chamber of Commerce and all metro area chambers of commerce for all they do to serve the business community, and I’m proud that Golden Real Estate pays dues to our own Chamber, regardless of the direct benefit we may gain from membership. It’s our way of giving back to the community by providing sustenance to an organization that serves the community.

We are also grateful to have made the move to downtown Golden, now occupying a storefront next to Ace Hi Tavern. Come by and say hello, perhaps during December 2nd’s candlelight walk!

I also thank Wendy Renee of Fairway Independent Mortgage Corporation for choosing to office inside Golden Real Estate’s storefront. She adds important expertise to our office and helps us to serve the many walk-ins we are welcoming in our new location.

Last but not least, Rita and I are thankful for our relationship with each other and our extended family. Happy Thanksgiving to all!

Here’s How Denver’s Real Estate Market Has Performed Since the Start of the Pandemic and the Recent Surge in Interest Rates

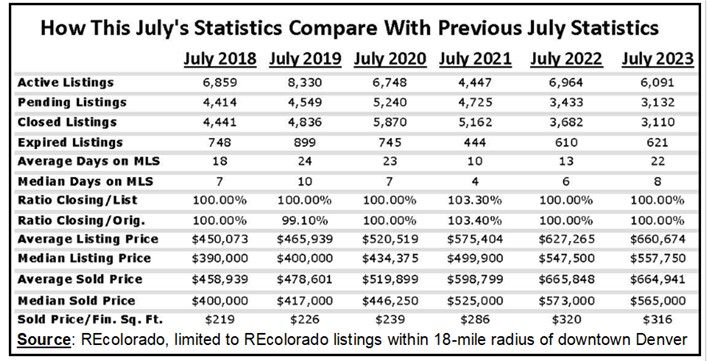
The charts below will not surprise any of us who have been witnessing the Denver real estate market over the past 2½ years. They do, however, document the death rattle of the seller’s market, which was killed by the Federal Reserve’s Open Market Committee, whose dramatic increases in the Federal Funds Rate were reflected in the amazingly quick increases in mortgage interest rates.

NOTE: The MLS charts above were created on REcolorado.com, limiting data to listings within an 18-mile radius of downtown Denver. That covers the entire Denver Metro area roughly within the C470/E470 beltway, but does not reach to the City of Boulder.

Back in January, when the 30-year fixed mortgage rate was just above 3%, it was hard to imagine that before year’s end the rate would be over 7%. The rates started rising in January, but they didn’t break above 4% until about the time that the FOMC started its aggressive rate increases.

(As a layman, I’ve never quite understood how inflating the cost of money is the best strategy for reducing inflation of everything else. And haven’t we noticed that that strategy hasn’t really worked yet? Some food for thought….)

Looking now at the three MLS charts, you can see that the number of sold listings exceeded the number of active listings throughout most the pandemic but sharply diverged starting around the time the FOMC rate increases began in mid-April.

The number of new listings saw no dramatic changes over previous years, but the number of listings that expired without selling was 3.24 times as high in October as it was in April of this year. Many of those new listings have sat on the MLS, as shown in the median days in MLS, which quadrupled from 4 to 16 days from April to October.

What may surprise observers is that the median sold price fell as little as it did from April to October. It is still higher than it was in January of this year when that 30-year fixed interest rate was about 3%.

What lies ahead? Homes are still selling, and buyers still need to buy, leading me to believe that we’ll see a “normal” market soon. Stay tuned!

Sales Taxes May Be Lower, but Property Taxes Are Usually Higher in Unincorporated Areas

It’s a common misconception that taxes are lower in unincorporated areas of each county, but that only applies to sales tax. I don’t know of any unincorporated area where property taxes are lower than they are in incorporated cities and towns.

Moreover, newer subdivisions in unincorporated areas typically have “metropolitan tax districts” that were created by the developer to pay for infrastructure — streets, gutters, sidewalks, water and sewer mains, etc. — which can make property taxes quite a bit higher than in the older areas of incorporated cities and towns.

Compare, for example, the mill levy for the City of Golden with the multiple mill levies in unincorporated areas of Jefferson County.

In Jeffco’s oldest incorporated city, Golden, the city’s mill levy is only 12.34 mills.  (The total mill levy for Golden is 85.389, the rest being for county government and for Jeffco Public Schools.)

In those homes which are not in the City of Golden but have Golden addresses, the mill levies to provide the same services (police, fire, parks, water and sewer infrastructure, etc.) are always higher. A good example is Mesa View Estates, the 1980s neighborhood behind the Jeffco Fairgrounds. Homes in that neighborhood have mill levies from four tax jurisdictions to provide the same services that are included in the City of Golden’s single mill levy.

Those four mill levies are: water & sanitation (6.786 mills); parks & recreation (6.829 mills); County sheriff (2.46 mills); and fire protection (13.196 mills). That’s a total of 29.271 mills, or over 2⅓ times what the City of Golden collects to provide the same services.

Thus, a $1 million home in the City of Golden would have an annual property tax bill of $5,934, whereas a $1 million home in Mesa View Estates would have an annual property tax bill of $7,042.

It’s even worse for homes in the Table Rock subdivision north of Golden but with Golden addresses. There the mill levy for police, fire, parks and water totals 18.447 (less than in Mesa View Estates), but there’s a levy of 31 mills by the Table Rock Metropolitan District, raising the annual property tax bill to $8,513.

There are many newer subdivisions with metropolitan tax districts which charge 50 or more mills, making the property tax bills that much higher. The most extreme example I have found is the Vauxmont Metropolitan Tax District serving Candelas in northern Arvada.  Its mill levy is 77.93, making the annual tax bill for a $1 million home $12,142. Again, compare that to the $5,934 tax bill for a $1 million home in the City of Golden.

Candelas, however, is in the City of Arvada, not unincorporated Jeffco.  Older sections of Arvada, such as Scenic Heights, do not have metropolitan tax districts, but they do have separate mill levies for fire protection and for parks and recreation districts. Similarly, Lakewood wasn’t incorporated until 1969, by which time there were multiple fire, water and parks districts already charging a mill levy. Still, the total mill levy in both Arvada and Lakewood — minus any metropolitan tax districts — is under 100 mills. Virtually all unincorporated areas of the county have total mill levies that are above 100.

Denver’s mill levy of 74.618 mills is even lower than Golden’s, although there are some metropolitan tax districts within Denver, such as Westerly Creek in Central Park (formerly Stapleton), which charges 60.867 additional mills.

As a side note, I sit on the Rules & Regulations Committee of our MLS and have suggested, without success so far, that listings in REcolorado include the mill levy instead of, or in addition to, the dollar amount of property taxes.

Sales taxes can only be levied by incorporated cities and towns and by state-constituted districts such as RTD and SCFD. I’m not aware of any county-level sales taxes. If you buy a truck or car worth, say, $100,000, you could easily save $3,000 in sales tax by registering it in an unincorporated area of the county, but that may not be enough to compensate for the additional property taxes you will be paying.

By the way, property tax is also levied as “ownership” tax on that $100,000 truck or car.

How Are Property Taxes Calculated in Colorado?

Property taxes are charged through a mill levy. Each “mill” (from the Latin word for thousand) is a tax of one dollar for each thousand dollars of your home’s assessed valuation.

In Colorado, the assessed value of residential real estate is currently calculated at 6.95% of the home’s full valuation. Thus, if the county assessor determines that your home is worth $1 million, its assessed valuation would be $69,500, and the mill levy for each taxing jurisdiction would be applied to that lower value, A mill levy of 100 mills would thus produce a property tax bill of $6,950 (which is 100 x 69.5)

The Colorado constitution requires county assessors to determine what each property could have sold for on June 30th of each even-numbered year (2020, 2022, 2024, etc.) and apply mill levies to 6.95% of that full valuation for the following two tax years.