NAR Economist Lawrence Yun Says ‘The Housing Recession Is Over’

In a July 27th article on realtor.com, the National Association of Realtors’ chief economist, Lawrence Yun, was quoted as saying, “The recovery has not taken place, but the housing recession is over. The presence of multiple offers implies that housing demand is not being satisfied due to lack of supply.”

“The West—the country’s most expensive region—will see reduced prices, while the more affordable Midwest region is likely to see a small positive increase,” Yun was quoted as saying in the article.

Yun’s analysis was based on June statistics, but I can see some evidence of his statement in my own experience. My newest listing in Lakewood, featured last week for $700,000, went under contract in three days amid competing offers for $720,000, leading to cancelation of the open house scheduled for day 4.

Another listing, a $1,250,000 ranch in north Golden, also went under contract last week for just below its listing price.

The fact remains that the increase in mortgage interest rates has many sellers holding onto their current home even though they’d like to move. If you had a 2.9% mortgage on your current home, you’d want to stay put rather than give it up and buy a replacement home with a 7% mortgage, right? The industry refers to homeowners in that situation as “rate-locked.”

Builders of new homes are benefiting from the low inventory of existing homes for sale. The sale of new homes surged in May and declined in June, but the trend is still upward. Buyers like buying a new home because, in addition to being new, they can usually be purchased without a bidding war.

Yun, of course, is quoting national statistics, but you and I know that all real estate is local, so I created the chart below using the tools available to me on REcolorado, Denver’s MLS, looking only at listings within 18 miles of downtown Denver.

Current inventory compares favorably with previous years in that chart, although pending and closed sales are down significantly. Values are still high, with the price per finished square foot near last July’s high.

Forecasters, me included, were surprised at the strength of the current real estate market.  We thought a true recession was in the cards, but in fact the market remains quite strong. I can only attribute the market’s performance to the large number of buyers still in the market and the continued low unemployment rate.

What will the market be like as we move into fall and winter?  Stay tuned, because I don’t want to venture a guess!

July Real Estate Market Analysis

Denver’s real estate market has undergone notable shifts this year when compared to past averages. Typically, around 8,757 active homes are on the market in July. However, this year, the number of homes for sale was under 6,000. 

High interest rates reduce the motivation for homeowners to sell, even if downsizing to a smaller property. Buyers face the same challenges due to higher interest rates. Many have postponed their real estate plans, waiting for lower rates.

The result is fewer transactions. This pattern is expected to continue through 2023. It resembles market activity from 2013 to 2019, with one notable deviation. This year, we’re observing more frequent and larger price reductions in both size and number of properties. These dynamics are shaping the landscape for both buyers and sellers, prompting strategic decisions in the face of evolving market conditions.

Megan Aller of First American Title contributed to this report.

What Are Some of the Common Mistakes That Homeowners Make When Selling?

I received an editorial submission on this topic, and it’s a good one, but I have my own points to make. The subheads below are his, but the paragraphs are mine.

Overpricing Your Home: We all make this mistake at times. The important thing is to take quick action. You know it’s overpriced when there are few or no showings and no offers. Don’t wait—reduce the price immediately or risk it becoming “stale.”

Neglecting Necessary Repairs: But what’s necessary? A furnace at the end of its expected life may be needed, but it’s not going to generate more showings or offers. Leave it as an issue to be brought up at inspection. Call it “lipstick on a pig” if you want, but I favor spending money on making your home more appealing visually to buyers, starting with your lawn care/landscaping and the exterior look of your home.

I focus on what I call “eyesores”: things that draw negative attention from a visitor to your home — carpet stains or noticeable wear; hardwood that badly needs refinishing; damaged countertops, peeling paint, etc. Note: the further the eyesore is from the front door, the less serious it is. The buyer has already fallen in or out of love with your house by the time he or she notices the shag carpeting in the basement bedroom. They are not going to change their minds by then.

Poor Home Staging / Presentation: I provide a free home staging consultation because this is so important. Decluttering and thinning your possessions is the one improvement that costs almost nothing. If you don’t want to do this, I’ll refer you to another Realtor and get a referral fee! I want my sellers to appreciate the importance of “looking good.”

Mistakes in Marketing/Listing: This is why you should use Golden Real Estate! We don’t skimp on marketing, as you have probably noticed. We do only magazine quality HDR photos using a professional photographer. We do narrated video tours with drone footage. Our “for sale” signs are classy and have solar powered lights. (And we make sure our signs are vertical.) We purchase a website URL for every listing. And we do all this whether it’s an inexpensive condo or a multi-million dollar home. Oh, yes, we also have a full-page weekly newspaper ad in the Denver Post plus three weekly newspapers which puts our listings in front of over 200,000 people who still read! (That’s a great demographic, but millennials are becoming an important demographic too, and we reach them through the blog posts and social media presentation of every article and listing that appears in our full-page ads.)

One piece of marketing that costs the agent only time, not money, is to complete ALL MLS data fields, not just the mandatory ones. Some of those optional fields, such as descriptions of each room, add a great deal of information for buyers. We complete those optional fields.

Ignoring Local Market Trends: We are currently in a “balanced” real estate market. The “seller’s market” of last year is over, but some sellers and their agents price their homes at a wished-for price that isn’t reflective of the slower market that we are now in.  I like how Megan Aller of First American Title puts it in her market presentations: “Sellers think it’s 2020 and buyers think it’s 2008.” 

Above all, remember that all real estate is local — it can be rising in one neighborhood and falling in another. And real estate is also emotional; sellers and buyers don’t always act rationally in the decisions they make about their home. Personally, I utilize three different valuation models when creating a market analysis for a prospective listing. 

Keep in mind the mortgage market, not just the real estate market. Yes, the interest rates are high right now, and no one can accurately predict when they will be lower. But there are programs for first-time homebuyers (defined, by the way, as someone who hasn’t owned for three years), for first responders, teachers and others. And there are ways to buy down the interest rate for one or two years in hopes of refinancing when rates are lower. If you don’t have a knowledgeable and hard-working loan office on your side, we have a couple we can recommend.

Metro Real Estate Market Exhibits Seasonal Cooling

Starting this month, I am partnering with Megan Aller of First American Title, in providing a statistical analysis of the prior month’s real estate activity in the Denver metro area. Megan is renowned for her diligent and in-depth analysis of the market, so, while this is under my byline, I am really conveying what she has told me.

As the Denver market enters a cooler season, the landscape is undergoing a notable shift with rising inventory and falling demand. This phenomenon, known as retraction, is causing a seasonal decline in prices as the balance between supply and demand evolves.

Recent data reveals a decline in the occurrence of multiple offers. For detached single-family homes, the percentage of properties selling for over asking price dropped by 4.7%, settling at 41.1%. Similarly, attached residences experienced a 2.0% decrease, with 37.4% of homes selling for over asking price.

While attached single-family home prices experienced a minor dip of 0.1%, averaging $480,656, detached single-family home prices rose by 1.7% month over month, reaching an average price of $796,702.

Both attached and detached homes currently have a supply of 1.3 months, indicating limited inventory. However, experts predict supply will likely increase in the coming months.

The shift towards a cooler market creates a favorable environment for prospective buyers. With a decrease in multiple offers and the potential for price adjustments, buyers have an opportunity to make their move in a less competitive market. Whether they are first-time homebuyers or looking to upgrade, the current market conditions present an opening for strategic decision-making.

If you’re interested in learning more about the metro Denver real estate market, my broker associates and I can provide valuable insights tailored to your specific needs. Our contact information is below.

The data in this report covers the following metro area counties: Adams, Arapahoe, Broomfield, Denver, Douglas, Elbert and Jefferson. This representation is based in whole or in part on content supplied by Metrolist Inc., d/b/a REcolorado. REcolorado does not guarantee nor is it in any way responsible for its accuracy. Data from REcolorado may not reflect all real estate activity in the market. All data above is for the month of June 2023.

It’s Still a Seller’s Market in Metro Denver – If Homes Are Priced Right

Here’s this week’s report on the real estate market in the Denver Metro Area.  Unlike others, I define the metro area geographically, not by county — as an 18-mile radius of Downtown Denver (see map), which includes Lone Tree but not Parker or Castle Pines to the South and Superior and Louisville but not the City of Boulder to the North.  To the west it goes to El Rancho, but not Evergreen, and to the east it goes to DIA but not Watkins.

In that area, there are currently 4,210 active listings with a median Days on MLS (DOM) of 28.  Only 830 of them are 7 days or less, which is the median DOM of the listings that closed in the last 7 days. Two-thirds of the active listings have been active over 14 days, and over 11% of the listings have been active over 120 days!  In short, we have a HUGE surplus of over-priced active listings.  (If you want to make a lowball offer, ask me or your agent to show you only listings that have been active over a month!)

Of the nearly 4,000 listings currently under contract within 18 miles of downtown Denver, the median days before going under contract was 9.  Of the listings that closed in last 7 days, the median days on the MLS was 7.  What does that say about the 80% of currently active listings that have been on the MLS over 7 days.  Not good!

There has been a big shift in Median Days on MLS this spring. Until last August, the median DOM had been under 10 throughout the pandemic, but between August 2022 and Feb. 2023, it ranged from 10 to 32 median days on the MLS.  But, surprise! Starting in March of this year, the median DOM is again under 10.  Happy days are here again — IF the home is priced right!

February Statistics Show Some Stabilization of Metro Denver’s Real Estate Statistics

Below is the “Market Overview” for February as published by the Market Trends Committee of the Denver Metro Association of Realtors (DMAR). It is for the 11-county “metro” area, which includes Elbert, Gilpin and Park counties.

One statistic omitted from the DMAR infographic is the median days in MLS, which fell dramatically compared to the average days in MLS. Defining metro Denver as a 23-mile radius of downtown Denver (not how DMAR chooses to define it), I find the average days-in-MLS for February to be 47 (up from 46 days in January) and the median days-in-MLS to be 24 (down from 34 days from January).

(Notably, the days-in-MLS statistics for the first several days of March are 39 and 13 respectively. We’ll check back in April to see how those statistics for March end up.)

That’s an important distinction, because what it tells us is that while there continue to be lots of overpriced homes sitting on the MLS, there are now enough right-priced homes on the MLS which are selling quickly to bring down the median days-on-MLS statistic.

This is a lesson which all sellers should take to heart — that if you price your home at or slightly below the market, you will sell your home quickly, but if you put it on the MLS at a hoped-for price that is above the market, it will sit on the MLS for a long time.

As I write this on Monday evening, these are the numbers of active Denver metro listings on www.REcolorado.com listed by days-on-market:

0-7 Days—610

8-14 Days—306

15-31 Days—478

32-60 Days—442

61-90 Days—193

Over 90 Days—743

We agents refer to listings that have been on the MLS over 30 or 60 days as “stale,” and those are good prospects for getting a low-ball offer accepted. Buyers can certainly be confident that they won’t encounter a bidding war for any listing that has been on the market more than a couple weeks — unless there was a recent price reduction. If you want to avoid bidding wars and get a good deal, ask your agent to send you only listings which have been on the MLS over 10 days.

Meanwhile, sellers need to recognize that if they overprice a home and later reduce the price to make it sell, they typically get less than if they had priced the home correctly.

For Jefferson County residents, here is the above analysis as it relates to Jeffco:

These are the numbers of active Jeffco listings on REcolorado by days-on-market:

0-7 Days—150

8-14 Days—62

15-31 Days—92

32-60 Days—82

61-90 Days—25

Over 90 Days—141

Here are the charts adapting that DMAR graphic to Jefferson County:

Fannie Mae Requires Appraisers to Use a Measurement Model for Square Footage Not Used by Realtors

How we measure the gross living area of a home is important, but there is little consistency. Different websites may use different numbers for the same home, primarily because they tend to have only one field for square footage.

Below, I’ll write about Fannie Mae’s new rules for measuring homes, but it’s up to each real estate website operator which number it uses for square footage. For example, the web page that we create for each Golden Real Estate listing has only one square footage field, so I choose to display finished square footage. The MLS has fields to distinguish between finished, unfinished, basement, above-grade, and total square feet, as shown below, and all those fields are uploaded to every consumer website, but I haven’t found any consumer website which displays all those fields.

Zillow is an example of a website which features only the total square footage in each listing, even if half that area is unfinished basement space. It doesn’t show the breakdown of finished vs. unfinished space or basement vs. above-grade space unless you click on a link titled “See more facts and features.”

Trulia, which is owned by Zillow, has a link “See all” which lists “finished area” if you scroll down far enough, but that’s all. I find this ironic, because both Trulia and Zillow provide a ton of information not found on the MLS, yet they downplay or omit the most important detail of all — the breakdown of square footage.

Redfin, which, like Trulia and Zillow, gets the full feed from our MLS, also features only the total square feet and has no link that I could find which displays a breakdown. And, like both Trulia and Zillow, Redfin prominently features “price per square foot,” but that figure is based on the total square feet, which can be really misleading.

Golden Real Estate’s website, like those three, gets its active listings from the MLS, but our display is managed by the MLS, and all listings on our website use the finished square footage number, which is, I believe, the most useful single number to use. But, once again, there’s only one field for displaying square footage.

The MLS has its own consumer-facing website, www.REcolorado.com, where you can search for listings. On that site, the total square footage is featured, but scroll down and you see this very thorough breakdown of square footage:

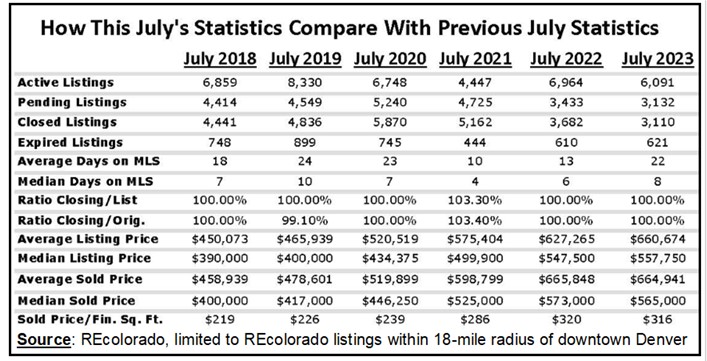
On other websites, you’d only see 3,166 square feet and $271/sq. ft. for the listing in this example.

The numbers  displayed on the MLS are entered by the listing agent. Our sole obligation in providing them is to indicate the source. It could be from public records, or it could be from a prior appraisal. We could also measure it ourselves, but that is really unlikely. The only requirement is that we disclose the source. The safest choice is public records, but those numbers could be wrong.

Fun fact: Square footage of a home, by whatever standard, is measured from the outside of the exterior walls, not the inside.

Lenders, of course, want to know that the square footage is accurate and consistent, so recently Fannie Mae mandated that all appraisers follow the ANSI (American National Standards Institute) standard, which can result in appraisals which come up with different numbers than in the MLS listing on which the buyer relied.

The ANSI standards don’t allow for space with ceiling heights under 7’ to be included in the gross living area, and the square footage of staircases can only be counted on the level from which the staircase descends. Also, if even part of a level is below grade, the entire level has to be counted as “basement,” which directly conflicts with MLS rules which say the lower level of a bi-level or tri-level home (which is at least partially below grade) can be counted as above-grade square footage.

Complicating matters, appraisers must measure properties using the ANSI standards, but they have no choice but to rely on MLS measurements for the comps they cite in an appraisal, which were surely not done to ANSI standards. The technical term for this is “apples and oranges…”

There are three different square footage numbers for every MLS listing, and here is a quick tutorial on REcolorado’s rules for measuring square footage.

Above-Grade square footage used to be called “Main” square footage. As the new name suggests, it does not include basement square footage.  But that begs the question, “what is a basement?”  In a split-level home, the lower level, which is often below grade, is included in the “above-grade” square footage, since there is frequently a basement below that level. In a “raised ranch” home, the lower level is included in “above-grade” square footage for the same reason. (A “raised ranch” is defined as a home where you have to climb a flight of stairs to get to the “main” level. The “main” level is defined as the level containing the kitchen.) 

Finished square footage includes all the finished square feet, whether in the basement or above-grade. If the basement is unfinished (or there is no basement), this number will be the same as the “Above Grade” number.

Total square footage is what the name suggests, whether finished or unfinished.

All three of these numbers will be different when a listing has a partially finished basement.

DMAR’s Metro Area Statistics Cover 11 Counties

What do the rural cities and towns of Kiowa, Agate, Simla, Fairplay, Georgetown, Empire, Black Hawk, Rollinsville, Nederland, Allenspark, Lyons, Longmont, and Bennett have in common?  They’re all included in the Denver metro area statistics compiled monthly by the Denver Metro Association of Realtors for its market trends report. Here is a map of the 11 counties included in that report.

REcolorado, the Denver MLS, allows infinite flexibility in drawing the boundaries when searching for listings or doing statistical analysis, so my preference is always to draw a radius of 20 miles from downtown Denver when compiling metro statistics.

Below is this month’s infographic from DMAR showing the November month-over-month statistics for their 11-county “metro area.”

Under all five elements of the infographic I have inserted the same November statistics for the 20-mile radius of downtown Denver that I prefer to use.

The variations this month are not as great as I have seen in some months.

NAR’s Annual Survey of Buyers and Sellers Shows Big Deviations From Past Years

 Every year the National Association of Realtors (NAR) surveys buyers and sellers of primary residences on a variety of topics. Usually, the changes from one year to the next are fairly minor, but the most recent survey (covering the period from July 2021 through June 2022) produced some big statistical deviations from prior years. Here are some of the findings that stood out to me.

1)   The percentage of first-time buyers dropped to a record low of just 27%, beating the previous record low of 30% in 1987 — 35 years ago! In the 2020-2021 survey it was 34%. The average age of first-time buyers jumped from 33 to 36. The average age of repeat buyers also rose — from 56 to 59.

2)   88% of all buyers were White, the highest percentage since the 1990s. Meanwhile, the percentage of buyers who were Black and Asian/Pacific Islander both dropped by half, from 6% to 3%. The percentage of buyers who were Hispanic/Latino rose slightly from 7% to 8%.

3)  Buyers moved an average of 50 miles from where they lived before, up from 15 miles the prior year, which was as high as it had been since at least the 1980s. (See chart below.) So, where did they move? Suburbs took a big hit, plunging from 51% to 39%, while rural and small town destinations jumped by half — 12% to 19% for rural areas and 20% to 29% for small towns. The NAR survey attributes that change to the pandemic’s effect of encouraging work from home. “Zoom towns were boom towns.”

4)   While only 3% of first-time buyers paid cash for their homes, 27% of repeat buyers paid cash, up from 17% the prior year. The survey attributes this to the surge in equity which homeowners had experienced in recent years, especially during the pandemic, providing them with lots of cash to spend on their replacement homes.

5)  How long buyers expect to remain in the home they just purchased had held steady since 2009 at 15 years for repeat buyers and 10 years for first-time buyers. The NAR survey showed a huge jump in that expectation for first-time homebuyers — from 10 years to 18 years. The expectation of repeat buyers remained unchanged at 15 years.

6)   The percentage of first-time buyers who had been renters plunged from 73% to 64%, while the number who moved from living with family or friends jumped from 21% to 27%. (See chart below.)

Click here to view the full summary of NAR’s 2022 survey of buyers and sellers.

Here’s How Denver’s Real Estate Market Has Performed Since the Start of the Pandemic and the Recent Surge in Interest Rates

The charts below will not surprise any of us who have been witnessing the Denver real estate market over the past 2½ years. They do, however, document the death rattle of the seller’s market, which was killed by the Federal Reserve’s Open Market Committee, whose dramatic increases in the Federal Funds Rate were reflected in the amazingly quick increases in mortgage interest rates.

NOTE: The MLS charts above were created on REcolorado.com, limiting data to listings within an 18-mile radius of downtown Denver. That covers the entire Denver Metro area roughly within the C470/E470 beltway, but does not reach to the City of Boulder.

Back in January, when the 30-year fixed mortgage rate was just above 3%, it was hard to imagine that before year’s end the rate would be over 7%. The rates started rising in January, but they didn’t break above 4% until about the time that the FOMC started its aggressive rate increases.

(As a layman, I’ve never quite understood how inflating the cost of money is the best strategy for reducing inflation of everything else. And haven’t we noticed that that strategy hasn’t really worked yet? Some food for thought….)

Looking now at the three MLS charts, you can see that the number of sold listings exceeded the number of active listings throughout most the pandemic but sharply diverged starting around the time the FOMC rate increases began in mid-April.

The number of new listings saw no dramatic changes over previous years, but the number of listings that expired without selling was 3.24 times as high in October as it was in April of this year. Many of those new listings have sat on the MLS, as shown in the median days in MLS, which quadrupled from 4 to 16 days from April to October.

What may surprise observers is that the median sold price fell as little as it did from April to October. It is still higher than it was in January of this year when that 30-year fixed interest rate was about 3%.

What lies ahead? Homes are still selling, and buyers still need to buy, leading me to believe that we’ll see a “normal” market soon. Stay tuned!