We all know that the Denver metro real estate market has changed dramatically this year, so I thought it would be interesting to compare the first 16 days of October with the same 16 days of October 2021. Here’s what I found.
I pulled the real estate sold listings on REcolorado, Denver’s MLS, for both years, limited to the area within 18 miles of downtown Denver, which roughly includes the area within the C-470/E-470 beltway, but does not include the city of Boulder.
Yes, the market has slowed, but the median sold price jumped from $450,000 for the first 16 days of October 2021 to $550,000 for the same period this year — a 22.2% increase. However, the number of closings plummeted from 2,411 during that period in 2021 to 1,650 this year, a 31.6% decline.
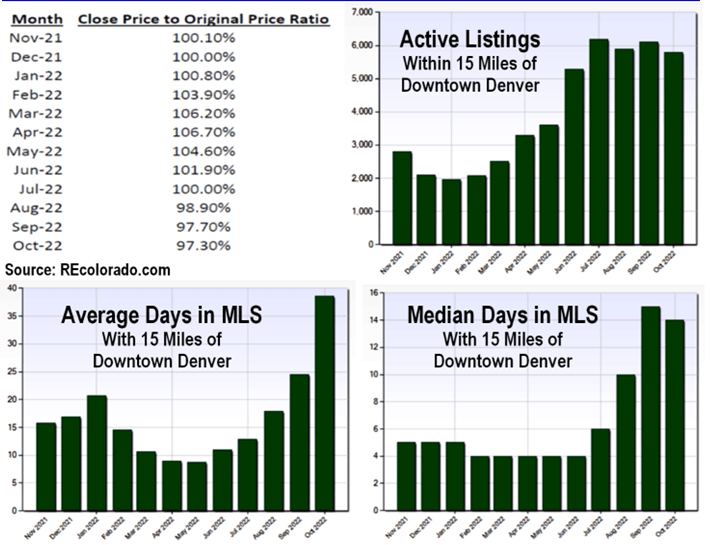
The ratio of sold price to original listing price dropped from 100.82% last year to 99.94% this year, and the median days before going under contract increased from 5 days last October to 16 days this year.
What effect did this year’s increase in interest rates have? During October 1-16, 2021, 18.1% of the closings were cash. During the same period this year, cash closings rose only to 18.25% — hardly any impact, it seems.
Anecdotally, I have observed that higher priced homes are selling more readily in this slower market, so I checked to see what percent of closings were $1 million or higher. During October 1-16, 2021, 6.51% of closings were over $1 million, but that rose significantly this October to 9.94% — and those million-dollar-plus homes sold quicker, with a median days before going under contract of 12, compared to 17 days for homes under $1 million.
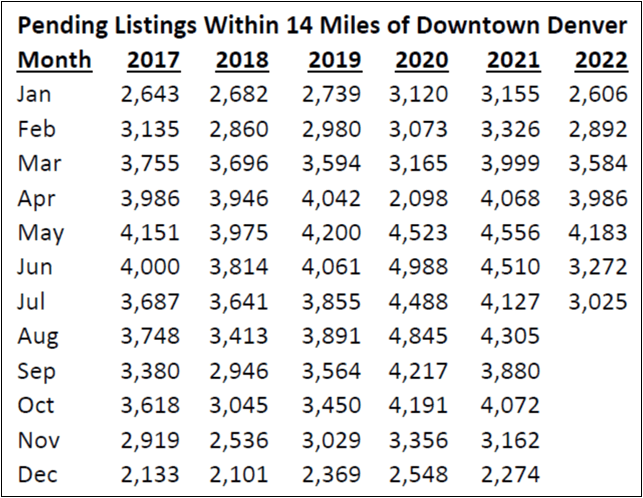
There are many more unsold (that is, active) listings now than there were last October — 5,996 compared to 4,386 last year — and fewer pending listings — 3,310 compared to 4,913 last October. A consistent characteristic of the seller’s market was that there were more homes under contract at any given time than there were for sale, which was frustrating for buyers who would see “for sale” signs in front of homes, more than half of which were not, in fact, available to purchase because they were under contract.
Price reductions continue to be quite common in today’s real estate market. Of those nearly 6,000 listings currently active within that 18-mile radius of downtown Denver, over 1,000 per week are reducing their listing prices. As a result, we’re seeing a surge of low-ball offers for listings in all price ranges, as buyers know that homes are not selling for their asking prices and might go for far less.
Just this week, I know of one listing that was on the market for 100 days, starting at $685,000 (a price that was justified by prior sales of comparable homes), reducing its listing price over time to $589,000. The seller finally threw in the towel and sold it to a quick-closing cash investor for under $500,000. That’s an extreme example, but it’s says a lot about the market we are in now.
That example also provides another lesson about the market, because it was an unrenovated home. It had an unimproved kitchen and unimproved bathrooms and nothing flashy or exciting to catch buyers’ attention. My observation has been that homes which are unimproved or otherwise “plain” are sitting on the market and selling only after serious price reductions, whereas homes that are newer or beautifully updated are selling quickly and even attracting a bidding war.
The reason is simple, as I see it: Buyers are simply not inspired to “pull the trigger” at this time, especially if they need to borrow money. It takes a lot to get an offer from them.